Aerial surveys / Industry
Quarries
How it works
- FlyA LiDAR or photo survey of the quarry, stockpile or dig.
- CompareAgainst an earlier survey, or the original ground estimated from the quarry rim.
- MeasureVolumes and tonnage, with a likely range for each figure.
- ReportFigures, maps and terrain models for planning and stock checks.
What you get
- Volumes and tonnageTonnage worked out from the rock type.
- Likely rangeHow certain each figure is.
- Cut and fill against planWhether extraction is on track or drifting.
- Haul roadsGrades, potholes and where roads are breaking up.
- Change between surveysWhere material has moved since last time.
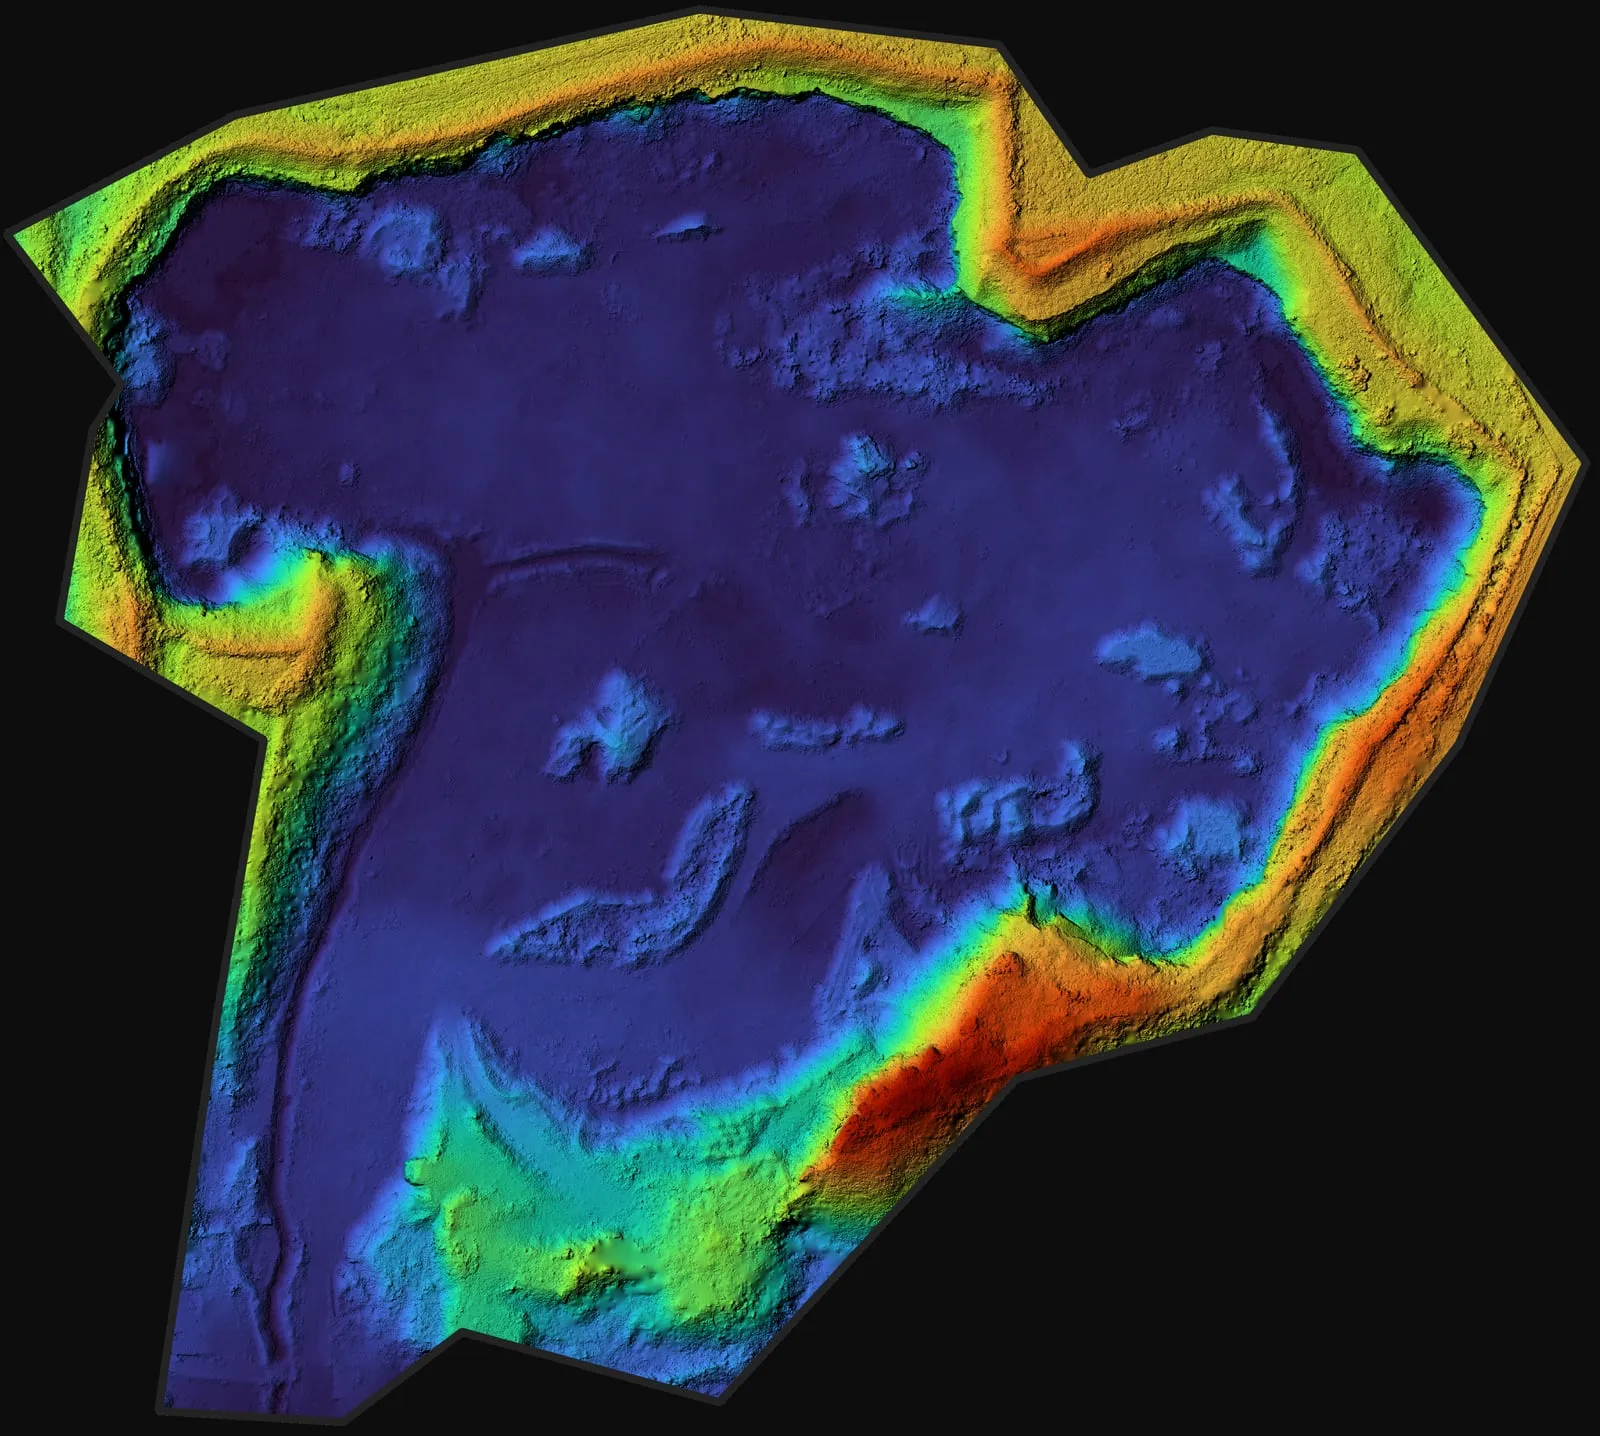
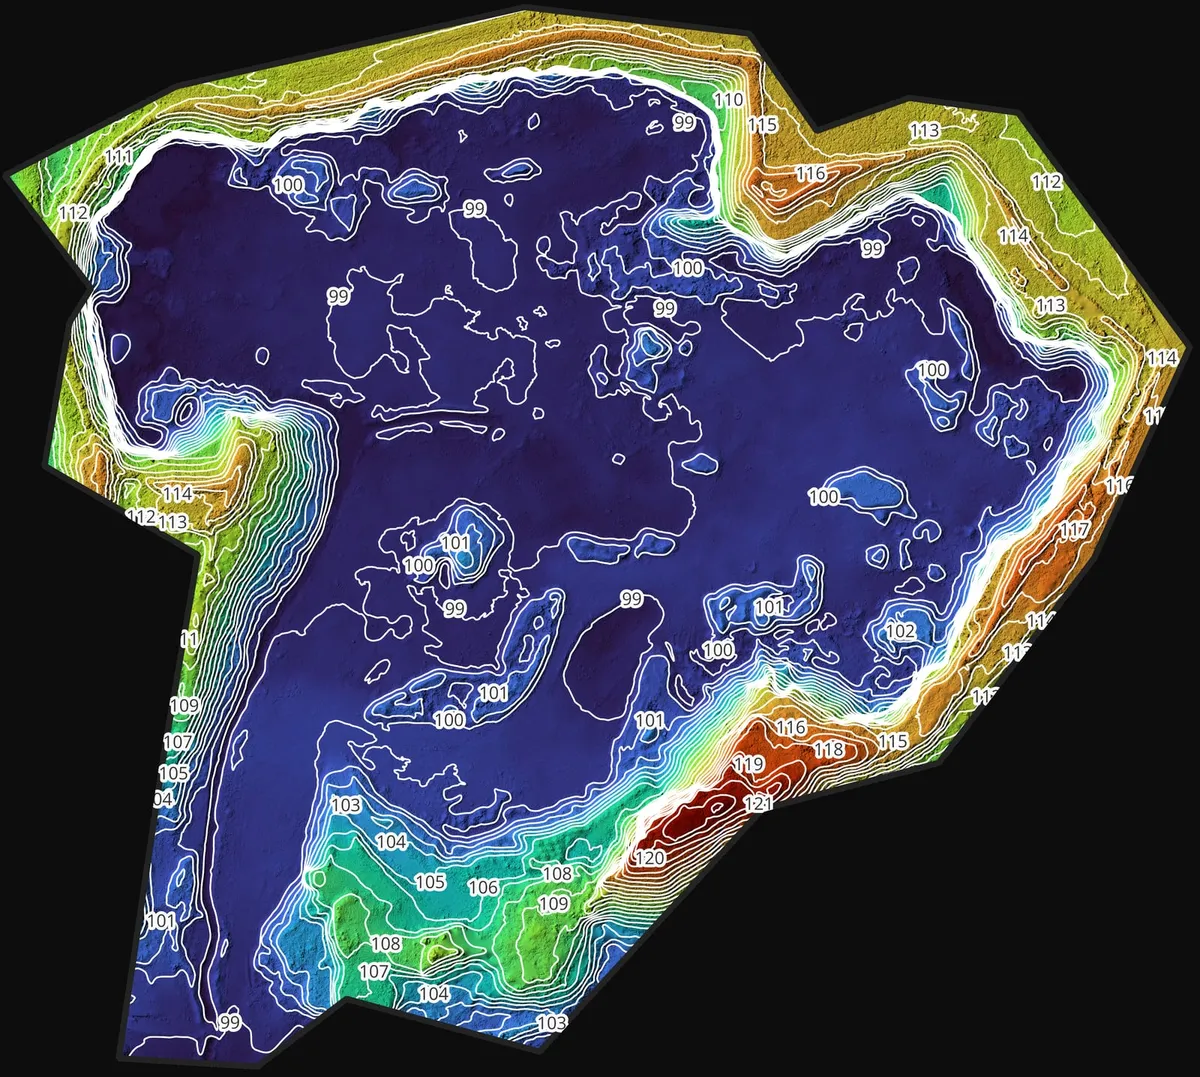
- Terrain modelA model of the ground from each survey.
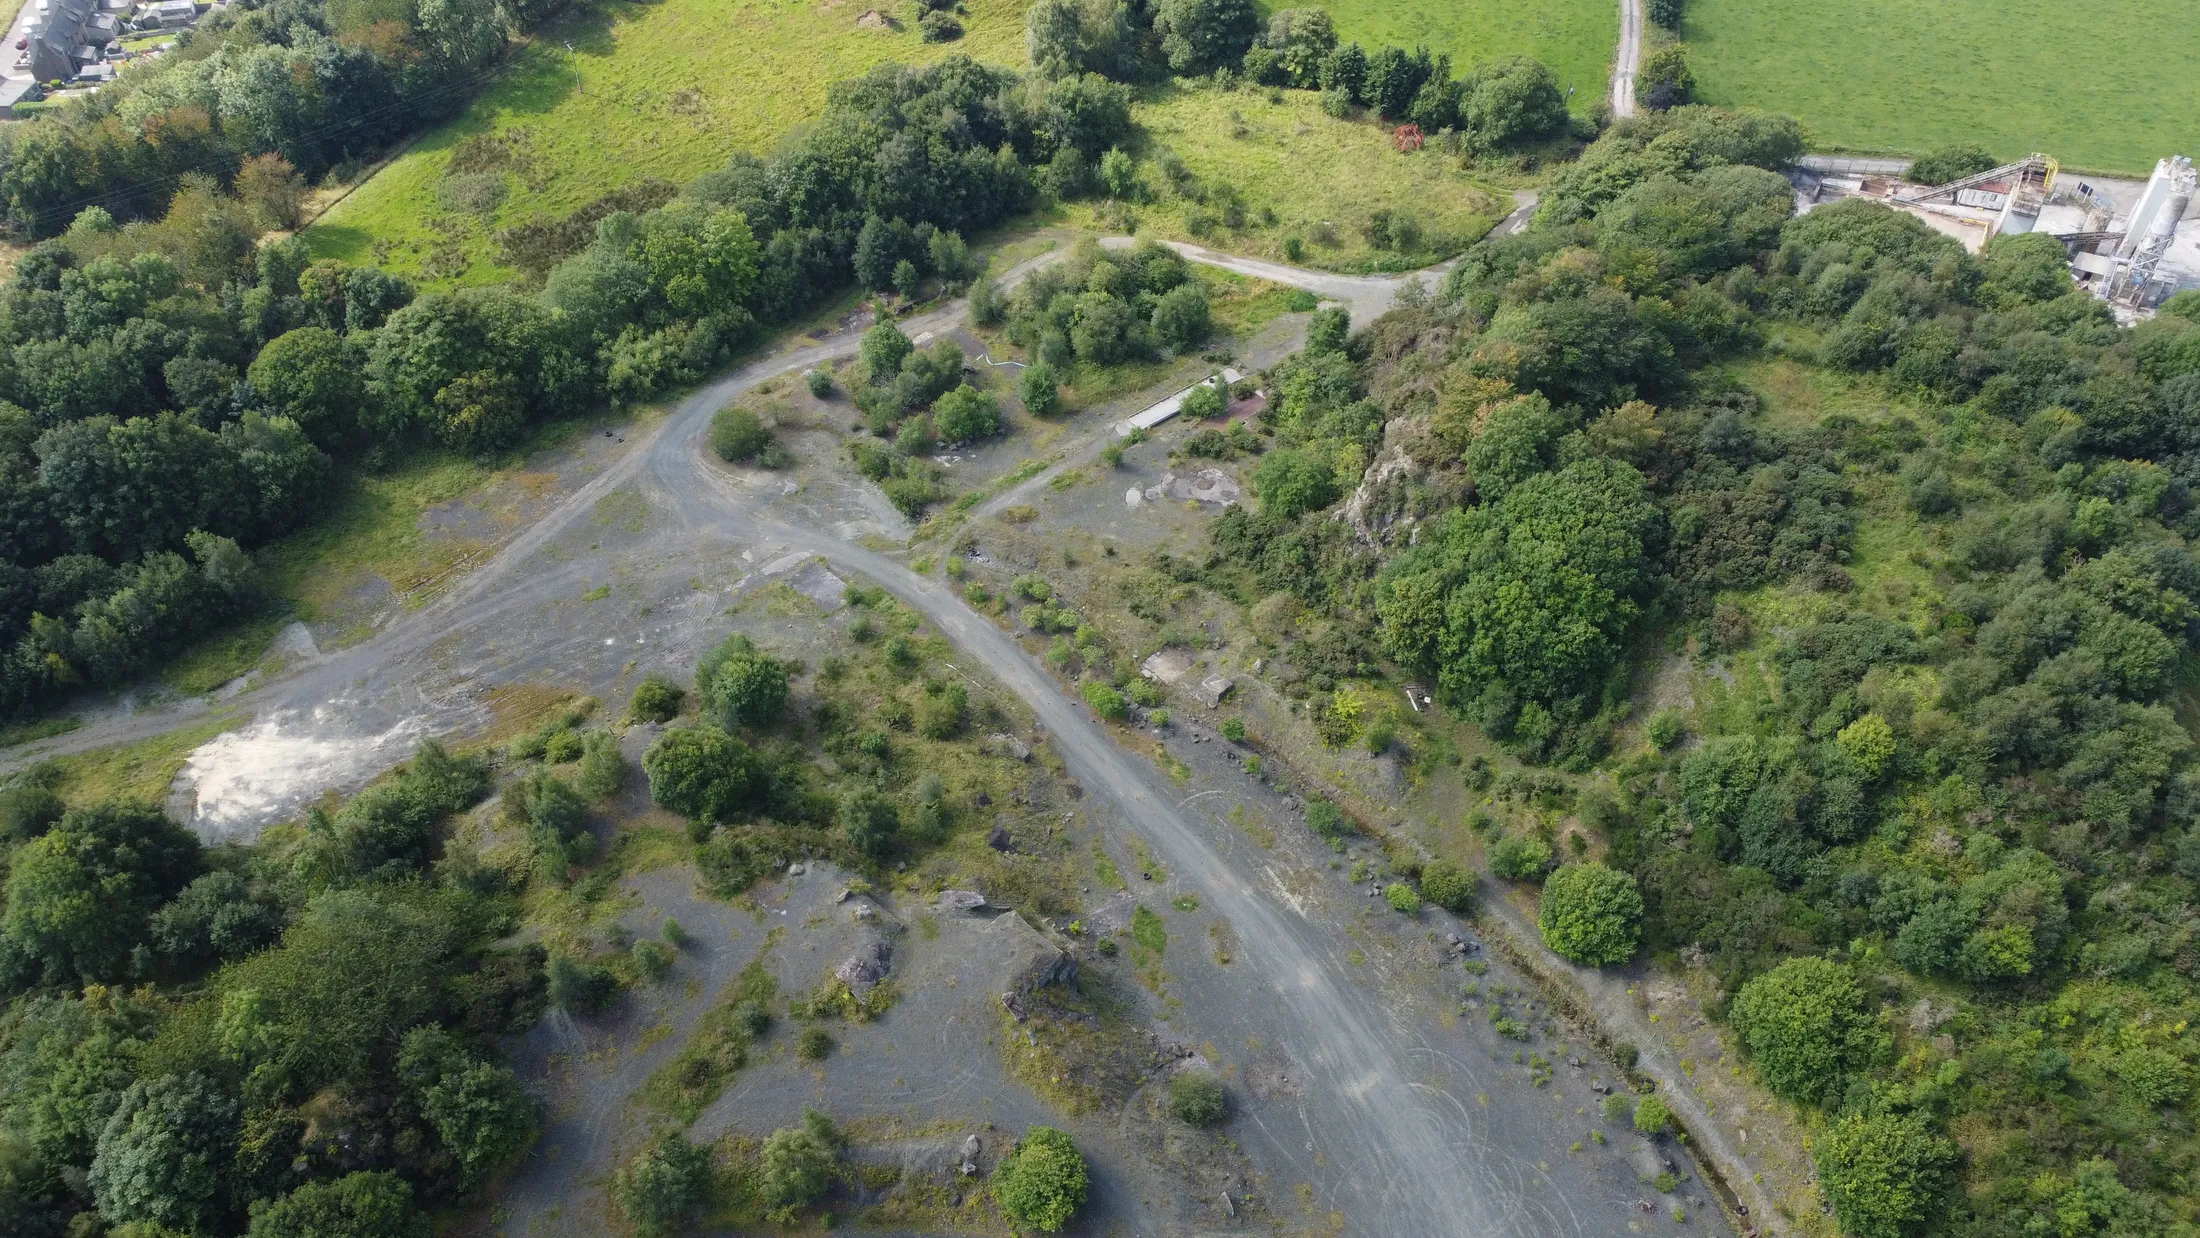
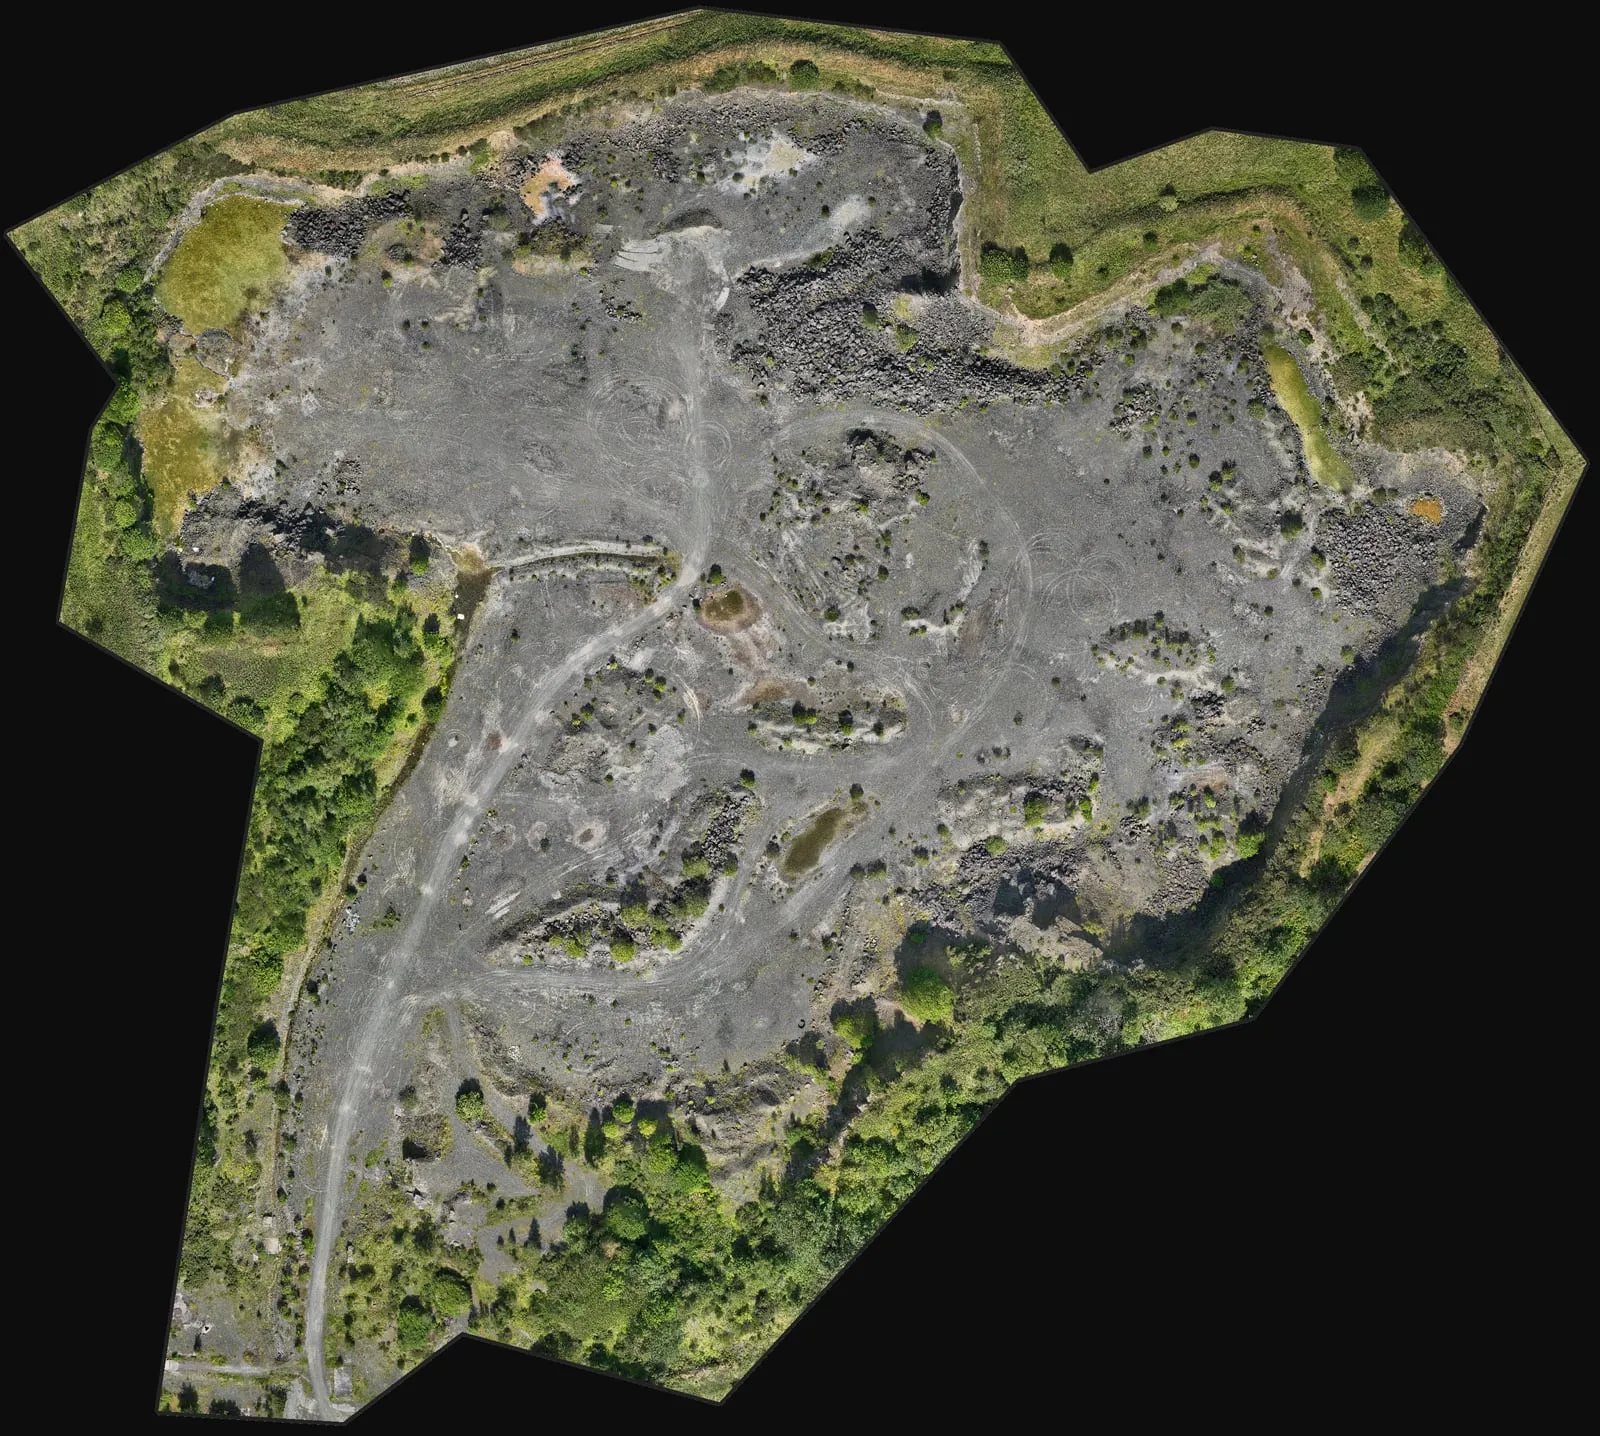
A disused quarry
We measured how much rock was taken out over the quarry's working life, and the two stockpiles left behind. The original ground was estimated from the quarry rim.
- Rock removed over the quarry’s working life
- 890,000 m³
- Likely range 2.51 to 2.72 million tonnes
- 2.6 million t
- The two stockpiles left behind
- 1,400 + 110 m³
- Absolute height accuracy (RMSE), checked against GNSS ground markers
- 2.6 cm
- Measured points per square metre
- 1,000+
- Ground heights meet RICS Band E (±50 mm)
- Band E
The likely range comes from a Monte Carlo analysis, which repeats the calculation many times with realistic measurement errors and rock densities.
Ask for a quote: mail@geoklein.com